Trends and Forecasts
Employment
level. In the District unemployment increased from 6.6% to 8.9% between 1990 and 1995.
Population
Socioeconomic Characteristics
The Affected Environment
D.C. Revenues
|
TOTAL D.C. GENERAL FUND REVENUES, FY 1995 and 1996 (In Thousands of Dollars) |
||
|
|
Actual |
Projected |
| Real Property Taxes | 654,300 | 640,100 |
| Individual Income Taxes | 643,700 | 658,100 |
| Business Franchise Taxes | 160,700 | 152,700 |
| Sales Taxes | 485,650 | 506,650 |
| Gross Receipts Taxes | 210,900 | 237,450 |
| Other Taxes | 61,300 | 140,700 |
| Subtotal | 2,216,550 | 2,335,700 |
| Local Nontax Revenue | 204,000 | 173,800 |
| Federal Payments | 660,000 | 660,000 |
| Grants | 855,305 | 822,600 |
| Other Financing Sources | 314,145 | 304,350 |
| Subtotal | 2,033,450 | 1,960,750 |
| Total Revenues* | 4,250,000 | 4,296,450 |
| SOURCE: DC FY 1997 Budget and Finance Plan. | ||
| * FY 95 total revenues were estimated from the General Fund Revenue Table | ||
Socioeconomic Environment
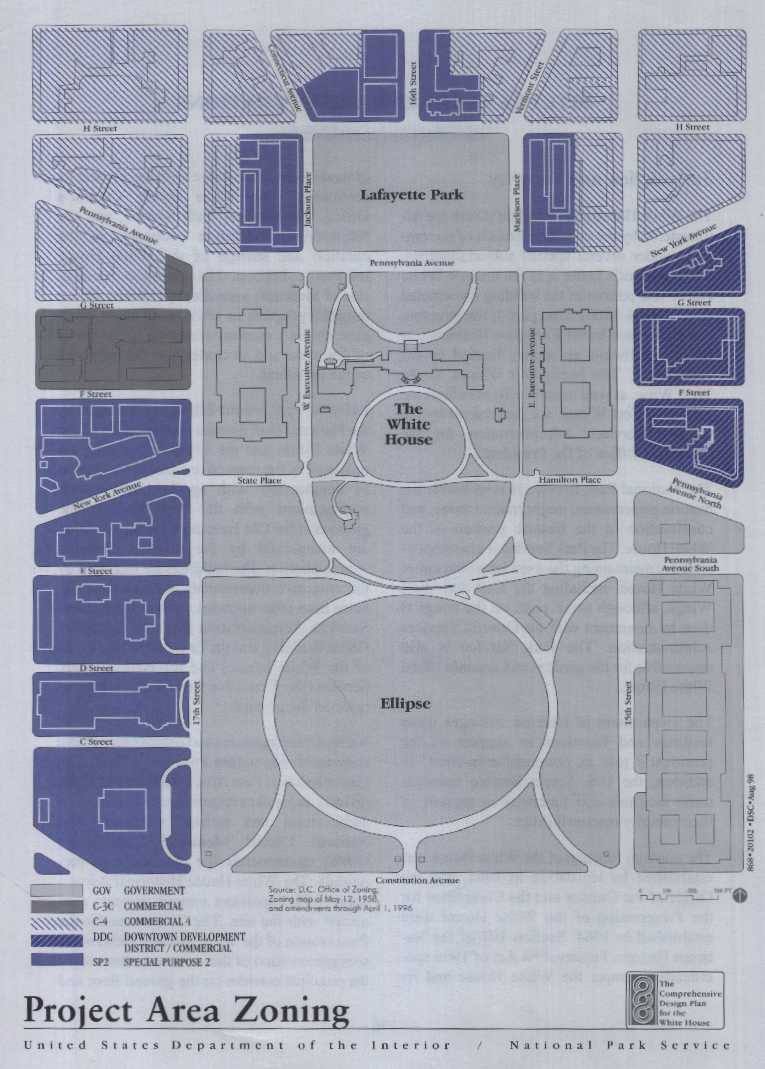
Land Use
|
PROJECT AREA LAND AND IMPROVEMENTS BY LAND USE CLASSIFICATION |
|||||
| LAND USE | PARCELS |
LOT SIZE (SO FT) |
GROSS BUILDING AREA |
ASSESSED LAND VALUE |
ASSESSED IMPROVEMENT VALUE |
| Commercial - Non-retail | |||||
| Office | 96 | 2,534,629 | 14,406,071 | $1,705,509,673 | $929,817,333 |
| Banks and Financial | 2 | 10,419 | 36,352 | 5,745,506 | 1,694,425 |
| Lodging | 2 | 34,369 | 316,876 | 19,587,937 | 10,584,413 |
| Subtotal | 100 | 2,579,417 | 14,759,299 | $1,730,509,673 | $942,096,171 |
| Commercial-Retail | |||||
| Retail Store | 3 | 36,226 | 292,802 | $29,066,292 | 1,615,282 |
| Theaters and Entertainment | 1 | 3,852 | 11,460 | 589,356 | 506,268 |
| Private Club | 1 | 12,229 | 81,695 | 6,677,526 | 4,510,400 |
| Restaurant | 2 | 5,206 | 12,756 | 3,387,060 | 179,460 |
| Store/Restaurant | 1 | 3,094 | 10,950 | 569,296 | 1,670,226 |
| Subtotal | 8 | 60,607 | 409,663 | $40,289,530 | $8,482,036 |
| Miscellaneous | |||||
| Parking Garage/Lot | 2 | 13,789 | 0.00 | $2,921,910 | $2,371 |
| Museum, Library, Gallery | 3 | 99,868 | 63,218 | 44,179,580 | 3,104,462 |
| Religious | 1 | 15,975 | 23,148 | 1,581,525 | 3,087,700 |
| Subtotal | 6 | 129,632 | 86,366 | $48,683,015 | $6,194,533 |
| President's Park | 5 | 3,834,422 | NA | NA | NA |
| Vacant | 4 | 66,687 | 5,085 | 37,578,447 | 0 |
| Project Area Total | 123 | 6,670,765 | 15,260,413 | $1,857,060,665 | $956,772,740 |
| SOURCE: D.C. Department of Planning, Property Database. | |||||
THE AFFECTED ENVIRONMENT
|
Project Area Land and Improvements by Zoning Classification |
||||||
| . |
|
|
|
|||
| Zoning Category | No. | Percentage | Sq Ft. | Percentage | Sq Ft. | Percentage |
| Commercial-3C | 2 | 1.6 | 323,226 | 2.1 | 47,434 | 0.7 |
| Commercial-4 | 66 | 53.2 | 7,568,091 | 49.6 | 837,170 | 12.6 |
| Commercial-5 | 1 | 0.8 | 210,935 | 1.4 | 21,490 | 0.3 |
| Special Purpose-2 | 15 | 12.1 | 2,155,343 | 14.1 | 691,219 | 10.4 |
| Government | 34 | 27.4 | 2,928,527 | 19.2 | 4,847,409 | 72.7 |
|
Downtown Development District / Commercial |
6 | 4.8 | 2,074,291 | 13.6 | 226,043 | 3.4 |
| Project Area Total | 124 | 100.0 | 15,260,413 | 100.0 | 6,670,765 | 100.0 |
| Source: D.C. Department of Planning, Property Database. | ||||||
SITE MANAGEMENT AND OPERATIONS
Jurisdiction and Security
Site Management and Operations
the principal public rooms on the first floor of the White House." Additionally, private groups, like the Lafayette Square Historic Association, monitor public interests in the district and individual sites. Historic associations for the Old Executive Office Building and the Treasury Building have been established to commemorate and preserve the history of each building, and each association provides tours (by reservation only) for its particular building. (Tours of the Treasury Building are staffed by Treasury employees, who volunteer their time.) The National Capital Planning Commission (started in 1926) reviews and approves projects that directly affect the property and its continuing evolution. The Pennsylvania Avenue Development Corporation (1962-96) implemented the renewal of Pennsylvania Avenue from the Capitol to the White House, including Sherman Park and the eastern side of the U.S. Treasury Building.
Maintenance Operations
President's Park
THE AFFECTED ENVIRONMENT
restoration afterwards. For permitted special events, NPS staff provide a number of services, including grass cutting, sanitation, and water. The special event sponsor is responsible for specific costs, such as staff overtime, trash bags, water bubblers, generators, and stages (beyond base daily costs). If the National Park Service cosponsors an event, then it funds all services. Table 7 lists events and demonstrations, and their duration.
White House
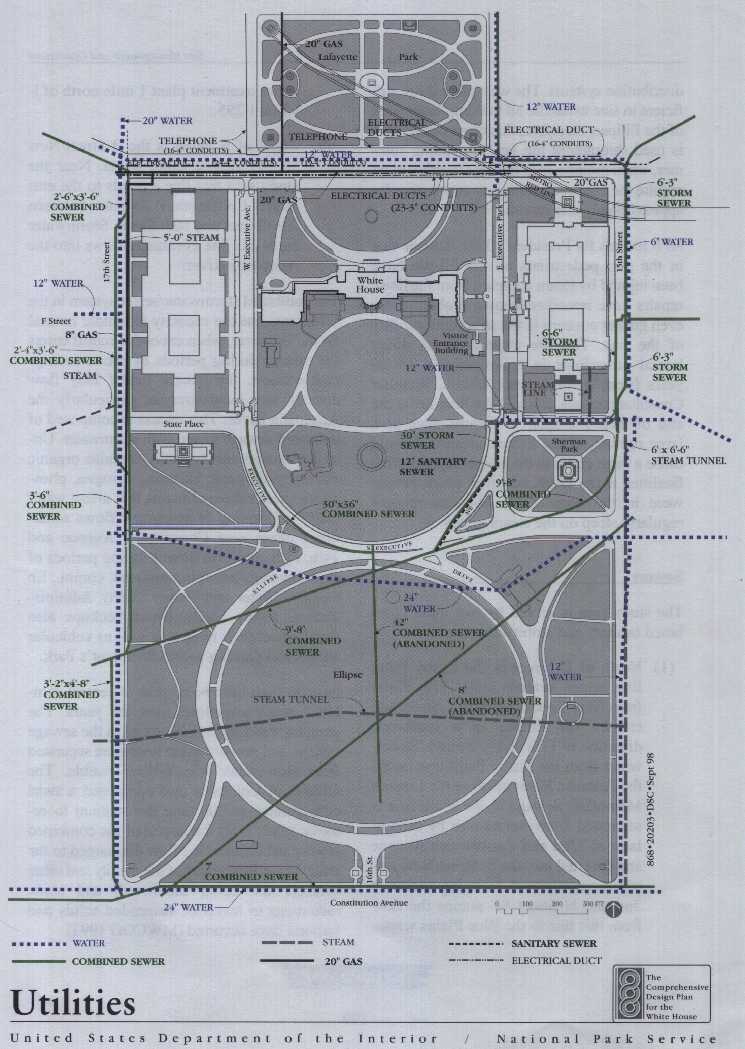
Utilities
Steamline
Site Management and Operations
distribution systems. The west plant is not sufficient in size to handle all building loads west of the Ellipse; therefore, this cross connection is used throughout the year, including summer, when maintenance outages at either plant require the cross connection to stay active for approximately one month.
Sewers
(l) North of E Street is the Easby Point line, which extends under 15th Street from New York Avenue to E Street and crosses the Ellipse in a southwest direction to l 7th and D Streets. Stormwater from the Easby Point line enters the Potomac River north of the Lincoln Memorial. Sewage in the trunk line is separate`] from slormwater by a regulator at 22nd and Constitution Avenue and diverted into the B Street/New Jersey Avenue line. A pumping station at 2nd and N Street SE pumps the flow from this line to the Blue Plains wastewater treatment plant l mile north of I-95 on 1-295 (2) South of E Street is the B Street/New Jersey Avenue trunk sewer. Near the study area this line extends to the east under Constitution Avenue between 23rd Street and 10th Street. Stormwater from this line eventually flows into the Anacostia River.